Daily sales report. How to sell a sales failure report to management
Analyzing a company's sales and profits is one of the important aspects of a marketing specialist's activity. Having a properly compiled sales report at hand will make it much easier for you to develop a marketing strategy for the company’s development, and the answer to the management question “What are the main reasons for the decline in sales?” won't take much time.
In this article we will look at an example of maintaining and analyzing sales statistics at a manufacturing enterprise. The example described in the article is also suitable for retail and wholesale trade, for analyzing sales of an individual store. The template we prepared for sales analysis in Excel is very large-scale; it includes various aspects of analyzing sales dynamics that are not always needed by every company. Before using the template, be sure to adapt it to the specifics of your business, leaving only the information that is needed to monitor sales fluctuations and assess the quality of growth.
Introductory Points to Sales Analysis
Before conducting a sales analysis, you need to collect statistics. Therefore, determine the key indicators that you would like to analyze and the frequency of collecting these indicators. Here is a list of the most necessary sales analysis indicators:
| Index | Comments |
| Sales in pieces and rubles | It is better to collect sales statistics in pieces and rubles separately for each product item on a monthly basis. These statistics allow you to find the starting point of sales decline/growth and quickly determine the reason for such a change. Also, such statistics allow you to track changes in the average price of shipment of goods in the presence of various bonuses or discounts for partners. |
| Unit cost | Product cost is an important aspect of any sales analysis. Knowing the level of product cost, it will be easier for you to develop trade marketing campaigns and manage pricing in the company. Based on the cost, you can calculate the average profitability of a product and determine the most profitable positions from a profit point to stimulate sales. Statistics on cost can be maintained on a monthly basis, but if this is not possible, then it is advisable to track the quarterly dynamics of this indicator. |
| Sales by sales lines or sales regions | If your company works with different regions/cities or has several divisions in the sales department, then it is advisable to keep sales statistics for these regions and areas. If you have such statistics, you will be able to understand which areas are primarily responsible for the growth/decline in sales and quickly find out the reasons for deviations. Sales by destination are tracked on a monthly basis. |
| Product distribution | Product distribution is directly related to the growth or decline of sales. If a company has the ability to monitor the presence of goods in the Republic of Tatarstan, then it is advisable to collect such statistics at least once a quarter. Knowing the number of points at which the shipped item is directly presented, you can calculate the turnover rate of goods at a retail point (sales / number of RT) and understand the real level of demand for the company’s products. Distribution can be monitored on a monthly basis, but it is most convenient to monitor this indicator quarterly. |
| Number of clients | If a company works with a dealer level or in the B2B market, it is advisable to track statistics on the number of clients. In this case, you will be able to evaluate the quality of sales growth. For example, the source of sales growth is an increase in demand for a product or simply geographic expansion in the market. |
Key points to pay attention to when conducting sales analysis:
- Sales dynamics by products and areas that make up 80% of the company’s sales
- Dynamics of sales and profits compared to the same period last year
- Changes in price, cost and profitability of sales for individual items, product groups
- Quality of growth: sales dynamics per 1 RT, per 1 client
Collection of sales and profit statistics
Let's move directly to an example that clearly shows how to do a sales analysis.
The first step is to collect sales statistics for each current product item of the company. We collect sales statistics for 2 periods: the previous and current year. We divided all the articles into product categories for which we are interested in seeing the dynamics.

Fig. 1 Example of collecting sales statistics by product items
We fill out the table presented above according to the following indicators: pieces, rubles, average selling price, cost, profit and profitability. The table data will be the primary source for future sales analysis.
Positional sales statistics for the year preceding the current period are necessary to compare current reporting indicators with the previous year and assess the quality of sales growth.
Next, we collect shipment statistics for the main areas of the sales department. We break down total revenue (in rubles) by sales areas and main product categories. Statistics are needed only in ruble terms, as they help control the overall sales situation. A more detailed analysis is necessary only if there is a sharp change in sales dynamics in one of the areas.
Fig. 2 Example of collecting sales statistics by sales directions and regions
Sales analysis process
Once all the necessary sales statistics have been collected, you can proceed to sales analysis.
Analysis of sales plan implementation
If the company is planning and has established a sales plan, then the first step is to evaluate the implementation of the sales plan by product groups and analyze the quality of sales growth (the dynamics of shipments in relation to the same period last year).

Fig. 3 Example of analysis of sales plan implementation by product groups
We analyze the implementation of the sales plan using three indicators: shipments in physical terms, revenue and profit. In each table we calculate the % of plan completion and dynamics in relation to the previous year. All plans are divided into product categories, which allows you to understand in more detail the sources of undersales and overfulfillment of the plan. The analysis is carried out on a monthly and quarterly basis.
In the table above, we also use an additional “forecast” field, which allows us to forecast the implementation of the sales plan given the existing dynamics of shipments.
Analysis of sales dynamics by areas
Such sales analysis is necessary to understand which areas of the sales department are the main sources of sales. The report allows you to evaluate the sales dynamics of each direction and timely identify significant deviations in sales in order to correct them. We break down total sales by OS areas, and for each area we analyze sales by product category.

Fig. 4 Example of sales analysis by area
To assess the quality of growth, the indicator “sales growth dynamics compared to last year” is used. To assess the significance of a direction in the sales of a particular product group, the parameter “share in sales, %” and “sales per 1 client” is used. Dynamics are monitored quarterly to eliminate fluctuations in shipments.
Sales structure analysis
Analysis of the sales structure helps to take a general look at the effectiveness and importance of product groups in the company’s portfolio. The analysis allows you to understand which product groups are the most profitable for a business, whether the share of key product groups is changing, and whether price increases cover the increase in costs. The analysis is carried out on a quarterly basis.

Fig. 5 Example of analysis of the sales structure of the company’s assortment
Based on the indicators “shipments in kind”, “revenue” and “profit”, the share of each group in the company’s portfolio and the change in share are assessed. The indicators “profitability”, “cost” and “price” evaluate the dynamics of values in relation to the previous quarter.

Fig. 6 Example of analysis of cost and profitability of sales
ABC analysis
One of the final stages of sales analysis is standard, which helps to implement a competent assortment policy and develop effective trade marketing activities.

Fig. 7 Example of ABC analysis of assortment
ABC analysis is carried out in terms of sales and profits once a quarter.
Residue control
The final stage of sales analysis is monitoring the company's product inventory. Analysis of balances allows you to identify critical items for which there is a large surplus or a shortage of goods is predicted.

Fig. 8 Example of analysis of product balances
Sales report
Often in companies, the marketing department is accountable for the implementation of sales plans. For a weekly report, it is enough to track the level of implementation of the sales plan as a cumulative total and indicate the forecast for the implementation of the sales plan based on the current level of shipments. Such a report allows you to timely identify threats of non-fulfillment of the sales plan and develop corrective measures.

Fig.9 Weekly sales report
Attach to such a report a small plate describing the main threats to the implementation of the sales plan and proposed solutions that will reduce the negative impact of the identified reasons for non-fulfillment of the plan. Describe what alternative sources can be used to increase sales.
In the monthly sales report, it is important to reflect the actual implementation of the sales plan, the quality of growth in relation to the same period last year, an analysis of the dynamics of the average shipping price and the profitability of the product.

Fig.10 Monthly sales report
You can download the sales analysis template presented in the article in the section.
Instructions
Compiling a report begins with writing a “header”. In the center of the sheet, two or three lines away from the edge, print “REPORT” in large font. Immediately below it - for the period from... to.... Next, if necessary, indicate the department, position and last name, first name, patronymic.
In the second paragraph, mark the real indicators. Calculate in percentage terms how much the plan was exceeded. If it was not completed, how much was short of the expected numbers. It is most convenient to organize it by week. This way it will be immediately clear in which period sales increased and in which they fell.
Analyze your competitors' sales growth rates. This will allow you to identify your position in the market and strengthen the company’s position in the future.
Identify the reasons for the decline in sales, if any. Most often, they are the approach of the product’s life cycle to the end, high competition in this market sector, and market oversaturation. Depending on the reason, the company must either launch a new product, strengthen its strengths, or enter new market segments. A timely decision can protect you from a further decline in sales.
note
The term “sales analysis” refers to a very wide range of tasks, including those that require the use of non-trivial techniques to solve. However, in most cases, it is enough for an analyst or sales manager to use spreadsheets filled with... information.
Helpful advice
At the initial stage, an analysis of sales dynamics, sales structure and sales profitability is carried out. At this stage, the trends that are developing in relation to sales (growth, stability, decline), as well as the influence of individual groups and categories of products/services on these trends and the level of this influence are determined.
Sources:
- Sales analysis and management decisions
With the need to compile report Almost every commercial director deals with sales. This document allows you to find out all the subtleties in the activities of the department and summarize the results. But before drawing conclusions, you need to put all the numbers together. To do this, data is analyzed according to several criteria.

Instructions
Determine how high a particular employee's performance is using personal report about sales. In it, take into account the number of acquired and lost customers, data on the average cost and profitability of transactions, etc., depending on the specifics of your business. The more criteria are taken into account, the more objective the result of the analysis will be. A sales personal will help you fully assess the activities of each team individually and adjust its work.
Check the profitability of your retail outlets using their sales reports. For owners of developed networks, this is especially valuable, as it allows them to analyze profitability and then, if necessary, adjust the operation of the enterprise.
Video on the topic
Conducting a sales analysis can help you identify more promising types of products or which products are bought best. It will also allow you to track trends in growth and decline in product sales. With this information, you can manage your sales more effectively.
Personal information:
Consulted in the field of regular management of more than 70 companies: from 10 to 9,000 people (including: holding companies, chain stores, factories, service companies, builders, government officials, web agencies, online stores). Student of Alexander Friedman.
One of the co-authors of the book "Social technologies of the Tallinn School of Managers. Experience of successful use in business, management and private life": http://www.ozon.ru/context/detail/id/140084653/
CEOPrecision is a courtesy of kings, but a duty for their subjects
Louis XVIII
to whom: owners, top managers
How a simulation of hectic activity can be accepted by a manager as a result of work
“What did my subordinates do today? What tasks did they complete? How long did it take, and what results were achieved?”- such exciting thoughts often haunt the leader. Where would they come from?
From the outside everything is great. As soon as the boss enters the office, everyone is immediately busy: small talk ends mid-sentence, someone begins feverishly typing on the computer, others busily transfer papers from one place to another, others immediately call all contractors in a row. Why does such a blissful picture give rise to “exciting thoughts”?
The fact is that an experienced leader understands perfectly well difference between “facts” and “opinion about facts”. But in order to understand what the subordinates entrusted to him were doing, it is necessary to arrange a detailed oral questioning of “what”, “how”, “when”, with “what results” and “who” did it. This takes a lot of time from both the manager and the employee. Therefore, the manager solves this problem according to the residual principle. And who will ask while he is on vacation or on sick leave?
This article will discuss a tool that allows you to separate “facts” from “opinions about facts” and measure the effectiveness and productivity of subordinates. Meet me. Daily work reports in a formalized form for each employee.
Working reports: description of technology and benefits
The technology of working reports is as simple as two and two. At the end of their working day, each employee must provide a report with a complete list of tasks completed and the time spent on each of them, along with a link to the result of the work.
Let me remind you that work reports are part of a larger technology - “Organizing the work of employees, taking into account working time by task using plans and reports and their analysis by the manager.” The general technology consists of the following elements:
- Daily planning for employees: organization and format requirements. Read more in the article ““.
- Analysis, evaluation and adjustment of employee plans, discussion of plans with the manager. See article “”.
- Daily reporting for employees: organization and format requirements. This is what I talk about in this article.
- Analysis, evaluation and conclusions from employee reports. More details in “”.
Key principles of work reports
- Employees must report on their work daily, regardless of their qualifications, position or any other factors.
- Reports must be sent strictly at the end of the current day (to which the report corresponds)
- The report must be provided electronically and stored so that the manager has the opportunity to review it in detail.
- Any senior manager should be able to view the reports of all his subordinates.
- The report should be as detailed as necessary to create transparency in the work performed without additional discussion with the employee.
- The manager reserves the right to analyze the report, ask questions about methods of performing tasks and evaluate the quality and effectiveness of the work performed.

Benefits of daily reports for managers
- 100% transparency of the actions of each employee based on the results of the working day, week, month, etc. Now there is no need for oral questioning: “what did you do?”
- Possibility of deferred verification of employee activities. It is not always possible to check everyone at once. Now you can open work reports and find out what manager Ivan Petrov did over the past 2 weeks during each working day.
- A tangible increase in employee productivity, because now you can ask for every “ten minutes” of an 8-hour working day.
- Significant time savings for both the manager and the subordinate due to the absence of hours-long surveys of “who did what.”
- A quick opportunity to weed out weak, unable to cope and not hardworking employees among newly hired and probationary employees. Now their results are “in full view” based on the results of each day.
- The “old-timers” of the company will not be able to relax and rest on their laurels either. Their work reports will tell everything for them.
- Reducing the manager’s stress level due to the “inability to conduct an inspection”, because Now you can evaluate the results of each employee at a convenient time.
Benefits of daily reports for subordinates
- A continuous process of gaining knowledge and experience from your manager. As a result: a sharp development of both professional and personal skills. In fact, the leader becomes a teacher-mentor with whom you regularly think together: about new and more effective ways to solve problems; how to further develop your “growth points” and strengthen your “weak points”; about mistakes made and preventing new ones from occurring.
- The habit of working “professionally”, which is always highly valued in the labor market: planning skills, time management, and the degree of responsibility for one’s actions are improved.
- The ability to independently assess your effectiveness. An employee can always look at his own work report, analyze it and outline steps for his further development.
- Faster career growth for those who are hardworking and do quality work. Clear and transparent demonstration of the result to the manager. Now with him there is no need to regularly drink beer and take a steam bath to talk about your achievements - everything is clearly visible. The reporting system in the organization significantly reduces the influence of masters of hidden games and “favorites”.

Requirements for the composition of the working report
- Name of completed task. It should make it clear what work was done. For example: “Pay a bill for the purchase of office equipment for the accounting department.”
- Result achieved. (example: “The invoice was partially paid because the seller did not have two scanners in stock”). If the result is NOT achieved, then next to the information about the occurrence and reaction to the problem/task that has arisen there should be information on how and when this problem is planned to be solved, and how to avoid it in the future. It is also necessary to indicate which regulations/standards require additions/changes /creation, and immediately set appropriate tasks in your plan. New tasks must have a link to the current one as a base source.
- Basic principle: every task must have a result. Where possible, the result should be in a formalized form (for example: if an employee conducts an interview, then as a result of the work: a list of selected candidates and brief information about them + a list of those with whom he spoke).
- If the task involved working with documents, files or other information, you must provide a direct link to these documents, or to the folder or location where they are stored.
- Important for managers! In all tasks related to management (for example: studying plans and reports of other employees, control, etc.), be sure to indicate brief results: achievements, shortcomings, trends, etc. Example “Task: Analyze the reports of employee Ivan Petrov for 2 weeks. Conclusions: “There are no proposals for some tasks to improve regulations. Petrov has become familiar with the conclusions and has taken upon himself to pay attention and formulate his proposals in more detail.”
- When studying any materials, attending conferences, meeting with partners, etc. a short summary must be drawn up + a link to it must be provided in the report.
- If the performer has the feeling that the total time spent on a task may raise a question from the manager, it is necessary to immediately explain “why so much time was spent.” (Example: Task: Issuing and sending an invoice to the Client. Time: 1 hour. Explanation: 1 hour of time was spent on issuing an invoice due to the need to re-agreed the wording 3 times with the Client on his initiative)
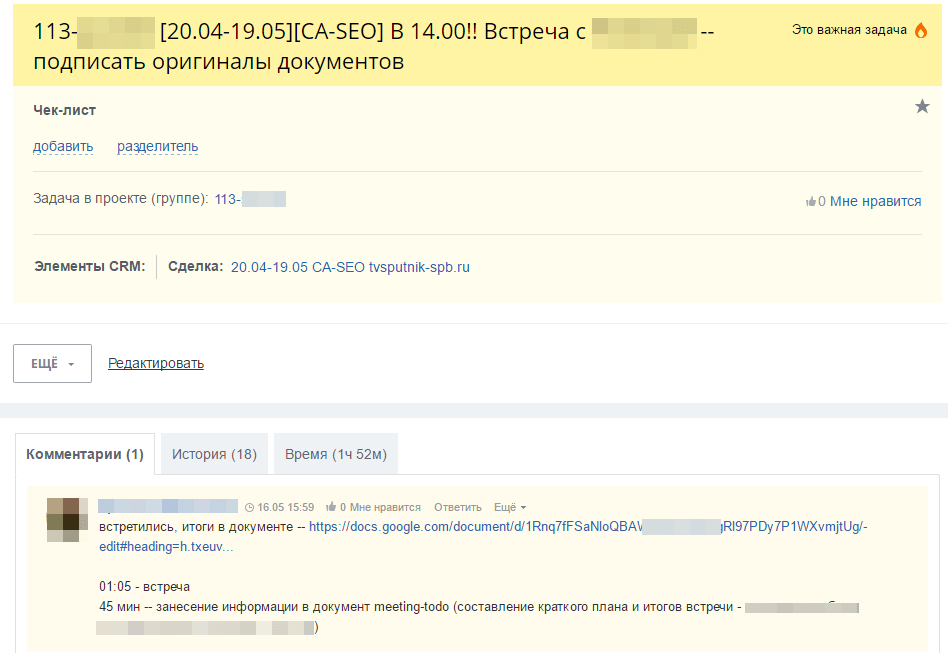
Example of a work report
The example shows a list of tasks from a report made in Bitrix24 (the system allows you to work centrally within the company and track time by task). With proper organization of planning and recording of working time by task, all reports will be generated automatically.

Example task result
Addendum to the work report
At the end of each work report it is necessary to put the following phrase (DD - date; MM - month; YY - year; HH:MM - hours + minutes format).
Total for DD.MM.YY:
1) Worked in the office: HH:MM
2) Worked from home: HH:MM
3) Total worked: HH:MM
4) Sick leave: HH:MM
5) Hours at your own expense: HH:MM
Rules for adding to the report (using the example of my company)
- Within one working day (day), “Total worked” and “Sick leave” can exceed 8 hours only if the sick leave is zero).
- Within one working day (day), “Total worked” and “Hours at your own expense” should give a total of 8 hours, no more.
- For example, I asked for time off at 01:19, lunch was reduced to 00:25 instead of 01:00, working time at the end of the day was 07:19. In “Hours at your own expense” write “00:41” plus a comment: asked for time off at 01:19, lunch 00:25 instead of 01:00 (i.e. record all deviations from working time standards).
- Time spent on a business trip or travel for work matters is also counted in the line “Worked in the office.”
- In the line where the time is zero, put 0:00
- To add a phrase quickly, you need to copy and paste it from previous reports, changing the time.
Sequence of implementation of work reports
It can be extremely difficult, and sometimes impossible, to introduce daily reports into the daily work of a department/company without a parallel project to introduce regular management. Read more about regular management in the article “.” Here I will briefly outline 2 main stages:
- First stage(duration: 2-3 weeks): employees are required to record in reports the five largest tasks completed, indicating the time for each of them. Implementation: GoogleDocs or text editors, possibly a system for setting tasks.
- Second phase(duration: 3 weeks and beyond): employees are required to record all tasks in reports indicating the time spent. Implementation: Bitrix24 or another task setting system.

When a work report may be unnecessary
For professions where the same type of repeatable actions are performed, it makes sense to introduce a standard for the number of tasks completed instead of a report. Initially, the desired average time to complete one task is estimated. Next, the norm is calculated using a simple action:<количестов рабочих часов>divide by<норма времени на выполнение одной задачи>.
For example, a call center operator may have a standard: 90 calls per day, 4 sales, etc. In this case, the manager looks at the deviation from the norm, and not at the work report. The situation will be similar with a worker who produces parts of the same type.
I am regularly asked the following question: “How often is it recommended to review an employee’s work reports?” The answer is banal: “As much as necessary to ensure the performance of a particular employee is acceptable to the company and the manager.”.
At the initial stage (1-1.5 months) of implementation, it is important to check everyone’s work reports every day. Subsequently, for some employees it is enough to check them once every 1-2 weeks, for others every day.
If a person has been working with reports for 1 year, and you are forced to check his report every day, you are not working as a manager: you are not providing the proper influence on a subordinate or you are keeping an ineffective employee.
Let's consider what capabilities the 1C Trade Management 11 program provides to its users for analyzing sales results.
UPDATE: added video “Sales analysis reports in 1C Trade Management 10.3”
From this video you will learn:
- How to analyze sales?
- How to build a sales report?
- How to view sales and balances in one report?
- How to build sales charts?
- How to view sales by payment?
Sales reports
By command "sales reports" We go to the sales reporting panel.
Similar articles:
- Tracking the movement of inventory balances in warehouses and...
- Formation of the assortment matrix and its…
The availability of reports in this panel is determined by whether the user has the appropriate rights to these reports, as well as by setting the visibility. Roles and rights are assigned to the user by the 1C program administrator. The user can control visibility himself using the command "Settings". In this case, checkboxes become available next to the panels; by checking and unchecking them, you can add or remove reports from this panel.
"Standard Terms of Sale"
Let's consider what opportunities we have for analyzing sales results. The first report is the “Standard Terms of Sales”. This report provides a list of standard sales terms, standard customer agreements registered in the system, and the basic information available in these agreements. Namely: name of the agreement; currency; type of price used; validity; our organization on behalf of which this agreement was concluded; business transaction (for example, sale or transfer to commission); taxation; stock; delivery time.
Price analysis
The next report is a price analysis. Available to us from documents such as commercial proposals, sales documents and customer orders. From each of these documents you can generate a report "price analysis". This report shows us information about the prices specified in the document (without a discount, with a discount), as well as about the prices of suppliers. Using this report, you can quickly analyze what prices we give to our customers and how they compare with the prices of our suppliers.
“Assessment of profitability of sales”
The following reports are also available from Sales Order documents. Namely, by opening the corresponding order, we can additionally display several reports in relation to this order.
The first of them is “Assessment of profitability of sales”. This report calculates the profitability of the order as a whole (including discounts, without discounts), and also provides detailed information for each item sold in this report. Now this report displays information about profitability of 100%. This is due to the fact that I have not yet calculated the cost price in my program for the current month, the routine closing operations of the period have not been carried out, and information on the cost price is not available. Accordingly, all proceeds are considered gross profit.
"Document Execution Status"
The following report is also available from the “sales order” ¾ this is the “Document Execution Status”. This report, firstly, provides information about the client’s debt (that is, how far the payment stages have been completed - say, advance, prepayment), information on shipment. And in the lower tabular part, in each product item, information is provided about what goods were shipped, in what quantity, for what amount.
Reasons for canceling orders
IN "Sales reports" There is a report on the reasons for canceling orders. This report collects information about the reasons why an order was canceled and provides quantitative indicators for each reason in terms of line cancellations in absolute and percentage terms. The information is also grouped by managers and by product price groups.
"Statement of settlements with clients"
The next report is “Statement of settlements with clients”. This report contains information on the status of mutual settlements with our clients. A list of our organizations and a list of clients is provided. The currency of mutual settlements is indicated. The counterparty on the part of our client is indicated. Information is provided on the debt at the beginning of the selected, analyzed period, information on the increase or decrease in debt, as well as the final balance and total balance.
"Customer debt"
The next report is “Client Debt”. This report shows information about customer debt. The information is grouped by debt currency. Information is provided about the client’s debt, our debt, settlement balances, as well as, based on information from the client’s orders, data on planned receipts from the client, planned sales to the client, or planned return of funds to the client.
“Dynamics of overdue debts of clients”
The next report is “Dynamics of overdue debts of clients”. This report shows information about the growth rate of overdue debt. In the tabular section, information is grouped by clients and managers. In our 1C Trade Management program (UT 11) 11.2, currently no overdue debt is registered (all debt is current), so this report is empty and does not contain any information.
Client payment discipline
A report on the client’s payment discipline can also be used for analysis. This report groups data by customer, provides data for the period on the number of sales orders, how many of them are overdue, what is the percentage of overdue debt and the average period of overdue, and also data at the end of the selected period.
"Customer debt by maturity"
The next report that may be useful in the analysis is “Customer debt by maturity”. This report must indicate the date on which the information will be analyzed, as well as the classification of the debt. We currently have one classification in the program. Each created classification indicates the periods for which the debt will be analyzed for overdue. The main postulate here is this: the most recent statements are the easiest to collect. The longer the period of delay, the more difficult it is to collect the debt. In this report, we receive information about each client, the status of mutual settlements with him, as well as information about the period of overdue debt.
Payment card with counterparty
From "Customer's order" You can get a report on the settlement card with the counterparty. This report displays information about mutual settlements for the entire period, that is, which documents were used to carry out monetary transactions, commodity transactions for sale or return. The total debt and information about its overdue status are also provided, if such data exists.
All these reports are available to us either in the section "Sales" in Group "Sales reports", either from settlement documents– documents used to document sales to a client, such as "customer orders" And "commercial offers to clients".
Such opportunities are provided to us by the 1C Trade Management program version 11.2 for analyzing sales results.

Creating a sales report by manufacturer and revenue 1C UT 8.3
This video tutorial describes how to build a report on sales by manufacturer and the revenue received from them in 1C trade management 8.3. The main point of the report is from which manufacturers’ products we receive the most income.
Retail sales analysis
To analyze the sale of goods by retail outlets, quite a lot of reports have been implemented in the configuration.
All of them are available in the section Sales.
Conduct assessment of goods balances in retail outlets according to the selected price type, it is possible using a report List of goods of the organization in item prices. In the report, we can set the selection by store and by the type of price that is assigned to the store. We also determine the reporting period.

This report reflects the Beginning and Final Balance, Income and Expense, for each item.
We can customize this report in more detail. For example, we are only interested in information on the Coffee nomenclature and specific dates for the movement of this product.
To do this we go to Settings and on the bookmark Selections select the desired product.

As a result, the report we needed was generated. From the report we see that at the beginning there was no balance in the Maxi Store, on 06/27/2016 there was a receipt of 100 units, and on 06/29/16 there was a sale of two units. Total at the end of the period the balance of coffee is 98 pieces.

For control of funds at the KKM cash desk use the report Cash in KKM cash desks.

In the generated report, we see the Beginning and Final Balance, the Amount of Sales and Receipts of DS, as well as the withdrawal of DS by day.
We can generate this report with details on documents; to do this, in the report settings, set the checkbox to the value - Registrar. As a result, a report will be generated in the context of documents (registrars).

If the ending balance is minus sign, then the store did not fully account for the goods sold.
If the balance at the end of the period positive, then the retail outlet did not fully pay for the goods sold.
If we are only interested in information about the amounts received from the company’s cash desk, then in the advanced report settings, on the Fields and Sorting tab, we clear all unnecessary checkboxes; only the checkbox for the value Entering DS remains selected.

As a result, a report of the following type will be generated.

The program has the ability to generate a report in a regulated form Bargaining-29. This report is designed to analyze retail sales. The report reflects balances at the beginning and end of the month, as well as documents used to document the movement of goods through the specified warehouse and the specified organization. The total indicators in the report are calculated according to the price type specified in the card of this warehouse.
Prices are filled in according to the values that are valid on the report date.


Analysis of demand for goods
To analyze the demand for goods, you can use ABC and XYZ sales analysis. ABC analysis is possible based on several indicators. ABC analysis of sales by sales volume allows you to distribute goods into ABC classes in terms of demand for goods by customers. Class A will include the most in-demand goods, and class C will include the least in-demand.
Conducting an XYZ sales analysis allows you to determine the stability of product sales. From the point of view of sales of goods, XYZ analysis allows us to divide goods into the following classes - stable demand for goods, trends towards increasing demand for goods, one-time purchases (irregular consumption).
Carrying out a combined ABC and XYZ analysis will make it possible to determine the optimal inventory management method(that is, plan to purchase only those goods that are consistently purchased in total volume).
The program supports several inventory management methods: volume scheduling based on demand forecast, " order by reorder point"(with a fixed volume or with a regular delivery interval), " made to order". Different replenishment methods can be assigned individually to each product in each warehouse. The inventory management method can be determined automatically based on ABC/XYZ classification of reserves. It is also possible to manually change the inventory management method.

Example. In accordance with the conducted ABC/XYZ classification of reserves goods are assigned to group AX (goods are sold consistently and have a high turnover, that is, they bring high income to the trading enterprise). For such goods, a method is established "Scope and calendar planning". Method "Order to order" is established for goods that belong to group AZ. For such goods, no stock is kept in the warehouse; the goods are ordered from the supplier only when a customer need arises (placing a customer order). Information about the presence of such goods in the warehouse is recorded in the report as excess stock and marked in red.
When analyzing the demand for goods, product restrictions (regulatory, minimum, insurance, maximum stock) are used. Product restrictions are calculated automatically using a regulatory task for each product item in each warehouse based on data on sales of goods.

When calculating the required (standard stock), the expected sales volume of goods (minimum stock) and possible surges in sales (safety stock) are taken into account. For additional insurance against the risk of shortage of goods, you can manually set a parameter such as the maximum stock of goods.
Filling out a sales plan using a formula
The video will help you navigate the types of needs, as well as understand why enterprises distinguish between these types.
Formation of orders according to plans
For some products, supplier lead times are very long, and it is impossible to order supplier goods to meet current needs - orders must be placed in advance. For such goods, it is proposed to form long-term purchasing plans and form orders to suppliers based on these plans.
Documentation procurement plan in the program can be formed both manually and automatically, based on various data sources from the program itself. As sources for the forecast, you can use: data from customer orders, sales volume over the past period of time, volume of purchases over a certain period of time, etc. You can also take into account the internal needs of the enterprise (orders from your own departments, orders from retail outlets, your own stores, the need for components for assembly, etc.). In this case, it is possible to add several sources, as well as select the maximum value from all sources.

For example, you can select a maximum value based on the sales volume for the previous month and all purchase orders and internal orders issued for the same period or the same period last year.
The list of planning data sources can be filled in as desired. Templates are used to fill out.
Orders to suppliers are formed in accordance with the drawn up plan, and the deviation of the planned and actually ordered quantities from the supplier is controlled. Thus, purchasing plans can also be used to verify the implementation of plans dictated by the supplier itself.

Monitoring sales indicators
IN "1C: Trade Management 8" There is a mechanism that allows you to promptly identify “problem” areas and can help you make the right management decisions, and, in addition, automatically inform you about situations where the state of indicators is still acceptable, but is already approaching critical.
So-called "Target Monitor" allows you to analyze the key performance indicators of the department and the enterprise as a whole and the degree of achievement of the set goals, taking into account the target trend (increase in the indicator, decrease in the indicator, keeping the indicator in a certain range). Information can be available to a manager anywhere in the world by accessing the “Target Indicators Monitor” functionality via the Internet.
In order for this to work, it is necessary to define the goals that are planned to be achieved. Each goal can consist of many subgoals, the successful achievement of which ensures the achievement of the fundamental goal.
Each goal is given a target indicator. In turn, for each target indicator, the target trend is indicated - the desired direction of changes in the indicator over time (minimization, maximization of the value or keeping within the acceptable value), and analysis options are configured.
For example:
The fundamental goal is revenue growth. This goal is planned to be achieved by increasing the number of customers and increasing the average sales amount. In turn, an increase in the number of clients is planned by attracting new clients and reducing the number of lost clients. And the increase in the average sales amount is planned by reducing the provided manual discounts.

It happens that the results of a quarter, or even a whole year of active activity, are not encouraging. We didn’t manage to sell as much as planned! Or there is catastrophically no profit. In this situation, a business owner will need a strong coach, or he can also sell his apartment (just kidding). To some extent, it’s easier for a hired sales manager. By correctly presenting the results of his work to the company owner, he can get a new chance.
So, the picture is bleak... Having received poor business results, the owner sees four alternatives:
– Close the business as unpromising. Lack of funds to continue investment, by the way, can also affect the classification of a direction as a dead end.
- Change team.
– Change the organization and/or intensity of work.
- Wait until everything gets better.
The hired manager will be satisfied with only options three and four. But the good thing is only option three. Let's focus on that. What would I, as a company owner, prefer to hear from the head of the sales department in a difficult situation?
- Accurate conclusions. Without trying to mask reality, but also without despondency and giving up. For example: “We misjudged the segment and refocused on another only at the end of the period.” Or: “Sales volume decreased, but profitability of sales increased by 5%.” But! Disguising failures with “tricky graphs”, references to external causes, or going into details will not work for long. The owner will agree to tolerate the deterioration or restructuring of the department for one to three blocks, no more.
- A clear analysis of the reasons for failure. What was missing and why – ideas, people, money, technology, effort? The explanation should be specific and, if possible, without emotional overtones. Few owners want to hear: “As I thought,” “As I said,” or “Everything is wrong with us.” Please note: if there are more than three reasons and all are compelling, then in the eyes of the owner this already looks like incompetence. Important: avoid appealing to external reasons unless absolutely necessary: low season, the market is in decline, crop failure in Nepal... During the countdown, all this sounds unconvincing. Before, you had to think.
- Who and how will compensate the company for failure? At least morally. I am not thirsty for blood, but I consider the recognition of personal shortcomings fair and correct for all parties. A good sales manager will even offer to forfeit part or all of the bonus. A good owner will not do this, but will appreciate it.
- Plan for overcoming the crisis. It has to be real and detailed, and I have to believe in the plan as much as the author believes in it. It is important that in most cases, promising to “work more” will not improve the situation. It is more important to work in a new way. For example, review the company’s pricing policy, introduce independent quality control of managers’ work, and provide training for salespeople on a regular basis. The owner must see the sales manager's willingness to manage in a new way. Most likely, developing a new strategy will require a transition to different planning principles or even the involvement of an external consultant. So get ready to persuade and be persuasive.
- Comparison of the situation in the company with the market. If you failed in sales, show how things are going in the market in general and among competitors in particular. Make the effort to find data sources and compare comparable indicators. The general decline of the market may justify you. But there is a big second “but”! If your competitors are doing too well, it is better to omit this item.
- Show achievable prospects. If during the period a good foundation was made for the next one or two quarters, then it is important to demonstrate this. But with details. The comment “We entered the market of a new region with good potential” looks pathetic without numbers. You shouldn’t put too much emphasis on internal achievements like “formed a strong department.” Given the low sales, this is rather annoying. Give encouraging forecasts and prospects at the end of the presentation to end on a positive note.
- And one last thing. Take care of the high-quality design and clear structure of the report presentation. Ideally, it should not spread over more than 20 slides (15 slides is even better!), and the train of thought should not be lost. Don’t delay the introduction, quickly talk about the results. Then - about the conclusions, and in conclusion - about the action plan and new goals. And don't forget to check for all types of errors. Good design and presentation will sweeten even the bitterest pill of weak results. Examples of good presentations can easily be found on the Internet, for example on the resource slideshare.net. But one more “but”: don’t get too carried away with creating beauty by presenting unsuccessful results.